Why Vaccine passports as currently implemented in most of the EU are a joke
Vaccine passports, function, uses, and what they are
What are they and what are they used for
Vaccines passports are nothing more then a certificate based on a QR code, this can often be downloaded in an app or downloaded and printed. They are used to allow access to a variety of places, often events, restaurants, bars, cinema's, and more.
A vaccine passport requires one of 3 things: (in most of the EU at the moment September 2021)
- A full vaccination
- A recent negative test
- A recovery within the last 6 months (although the duration might vary)
What is their function?
The idea is that this way society can be opened up again and lockdowns can be removed. Where the whole idea is that this should mostly stop/reduce the spread. Now that's a wonderful and great idea if they did actually achieve that and would treat people equally based on what the numbers and data say regarding relative risk (RR).
What does that require
For that to be the case a tested person should have an equal risk to have caught and transmit the disease in comparison to a fully vaccinated person that wasn't tested. As these conditions will allow either person to enter. Therefor from an objective and scientific perspective the transmission risks of either should be similar.
How do we get these results
For a fully vaccinated person we can find this value, a vaccinated person’s reduced probability or hazard of transmitting infection, or the vaccine efficacy against transmission, which we'll call VET.
For a tested person, we can set the infectionous as the baseline, and check the likelihood of them still having (infectiousness) Covid after getting tested.
Result for a tested person
The chances of that depend on the False Negative rate (FNR), which is approximately 10% for PCR testing 1. Let me quote a small part of their discussion, which also adresses some of the previously found FNRs for PCR testing:
The major strength of this study lies in the large sample size (100,001 SARS-CoV-2 rtRT-PCR tests from 95,919 patients) from which discordant results were identified. Discordant results were found for 0.05% of all patients tested. Based on re-testing of 49 patients with discordant results, the FNR and sensitivity of our LDT in this subgroup of patients was approximately 9.3% and 90.7%, respectively.
The FNR calculated from our data analysis is comparable to other reports. Data from earlier in the pandemic reported FNRs of up to 30% [6] with a systematic review on the topic reporting ranges from 2 to 29% [2]. A large study from New York evaluating the clinical performance of SARS-CoV-2 molecular testing found that on average up to 17% of positives were missed by the first test [22], while another American study reported a FNR of 3.5% in patients with discordant swab results within a 7-day period [1]. Two other studies have estimated sensitivities ranging from 89 to 94.6% [22, 23].
In the end we can conclude that the FNR is at most 30% and at it's lowest 2%, while it's most likely to be around 10% as also shown in this paper (I've also read the other ones).
Result for a vaccinated person
Now estimating the VET for vaccinated people is a bit more tricky as there haven't been really any decent publications I could find on it with regards to people having been vaccinated 3+ and 6+ months, as the long-term data with regards to vaccines is critical, as we can't keep giving the entire population booster shots every 6 months not even considering the risks that come with continuous booster shots.
Now we can calculate the VET based on the VES and VEI:
- VES, Susceptibility to infection; vaccinated person’s reduced probability or hazard of becoming infected
- VEI, Infectiousness; vaccinated person’s reduced probability of infecting others, if they do become infected
- VET, Transmission; vaccinated person’s reduced probability or hazardof transmitting infection, incorporating VES and VEI
The VET = 1 - (1-VES)(1-VEI) 2
Finding the VES
The VES is basically effectiveness of getting an infection between an unvaccinated person and a vaccinated person getting an infection (in vaccinated people this is called a breakthrough). Now while this value can vary between vaccines, there are a few places where people have been vaccinated over 6 months with high degrees of vaccination (allows for decent randomisation).
For this we'll take a look at two vaccines, Pfizer and Astrazeneca. The reason for this is that not only are those the two most commonly used, they also represent the two types of vaccines technology used fairly well, mRNA and adeno-vector, respectively.
Thus we'll be looking at data from Israel first, since they almost only used Pfizer, afterwards we'll look at data from the UK, which has used slightly more Astrazeneca than Pzifer.
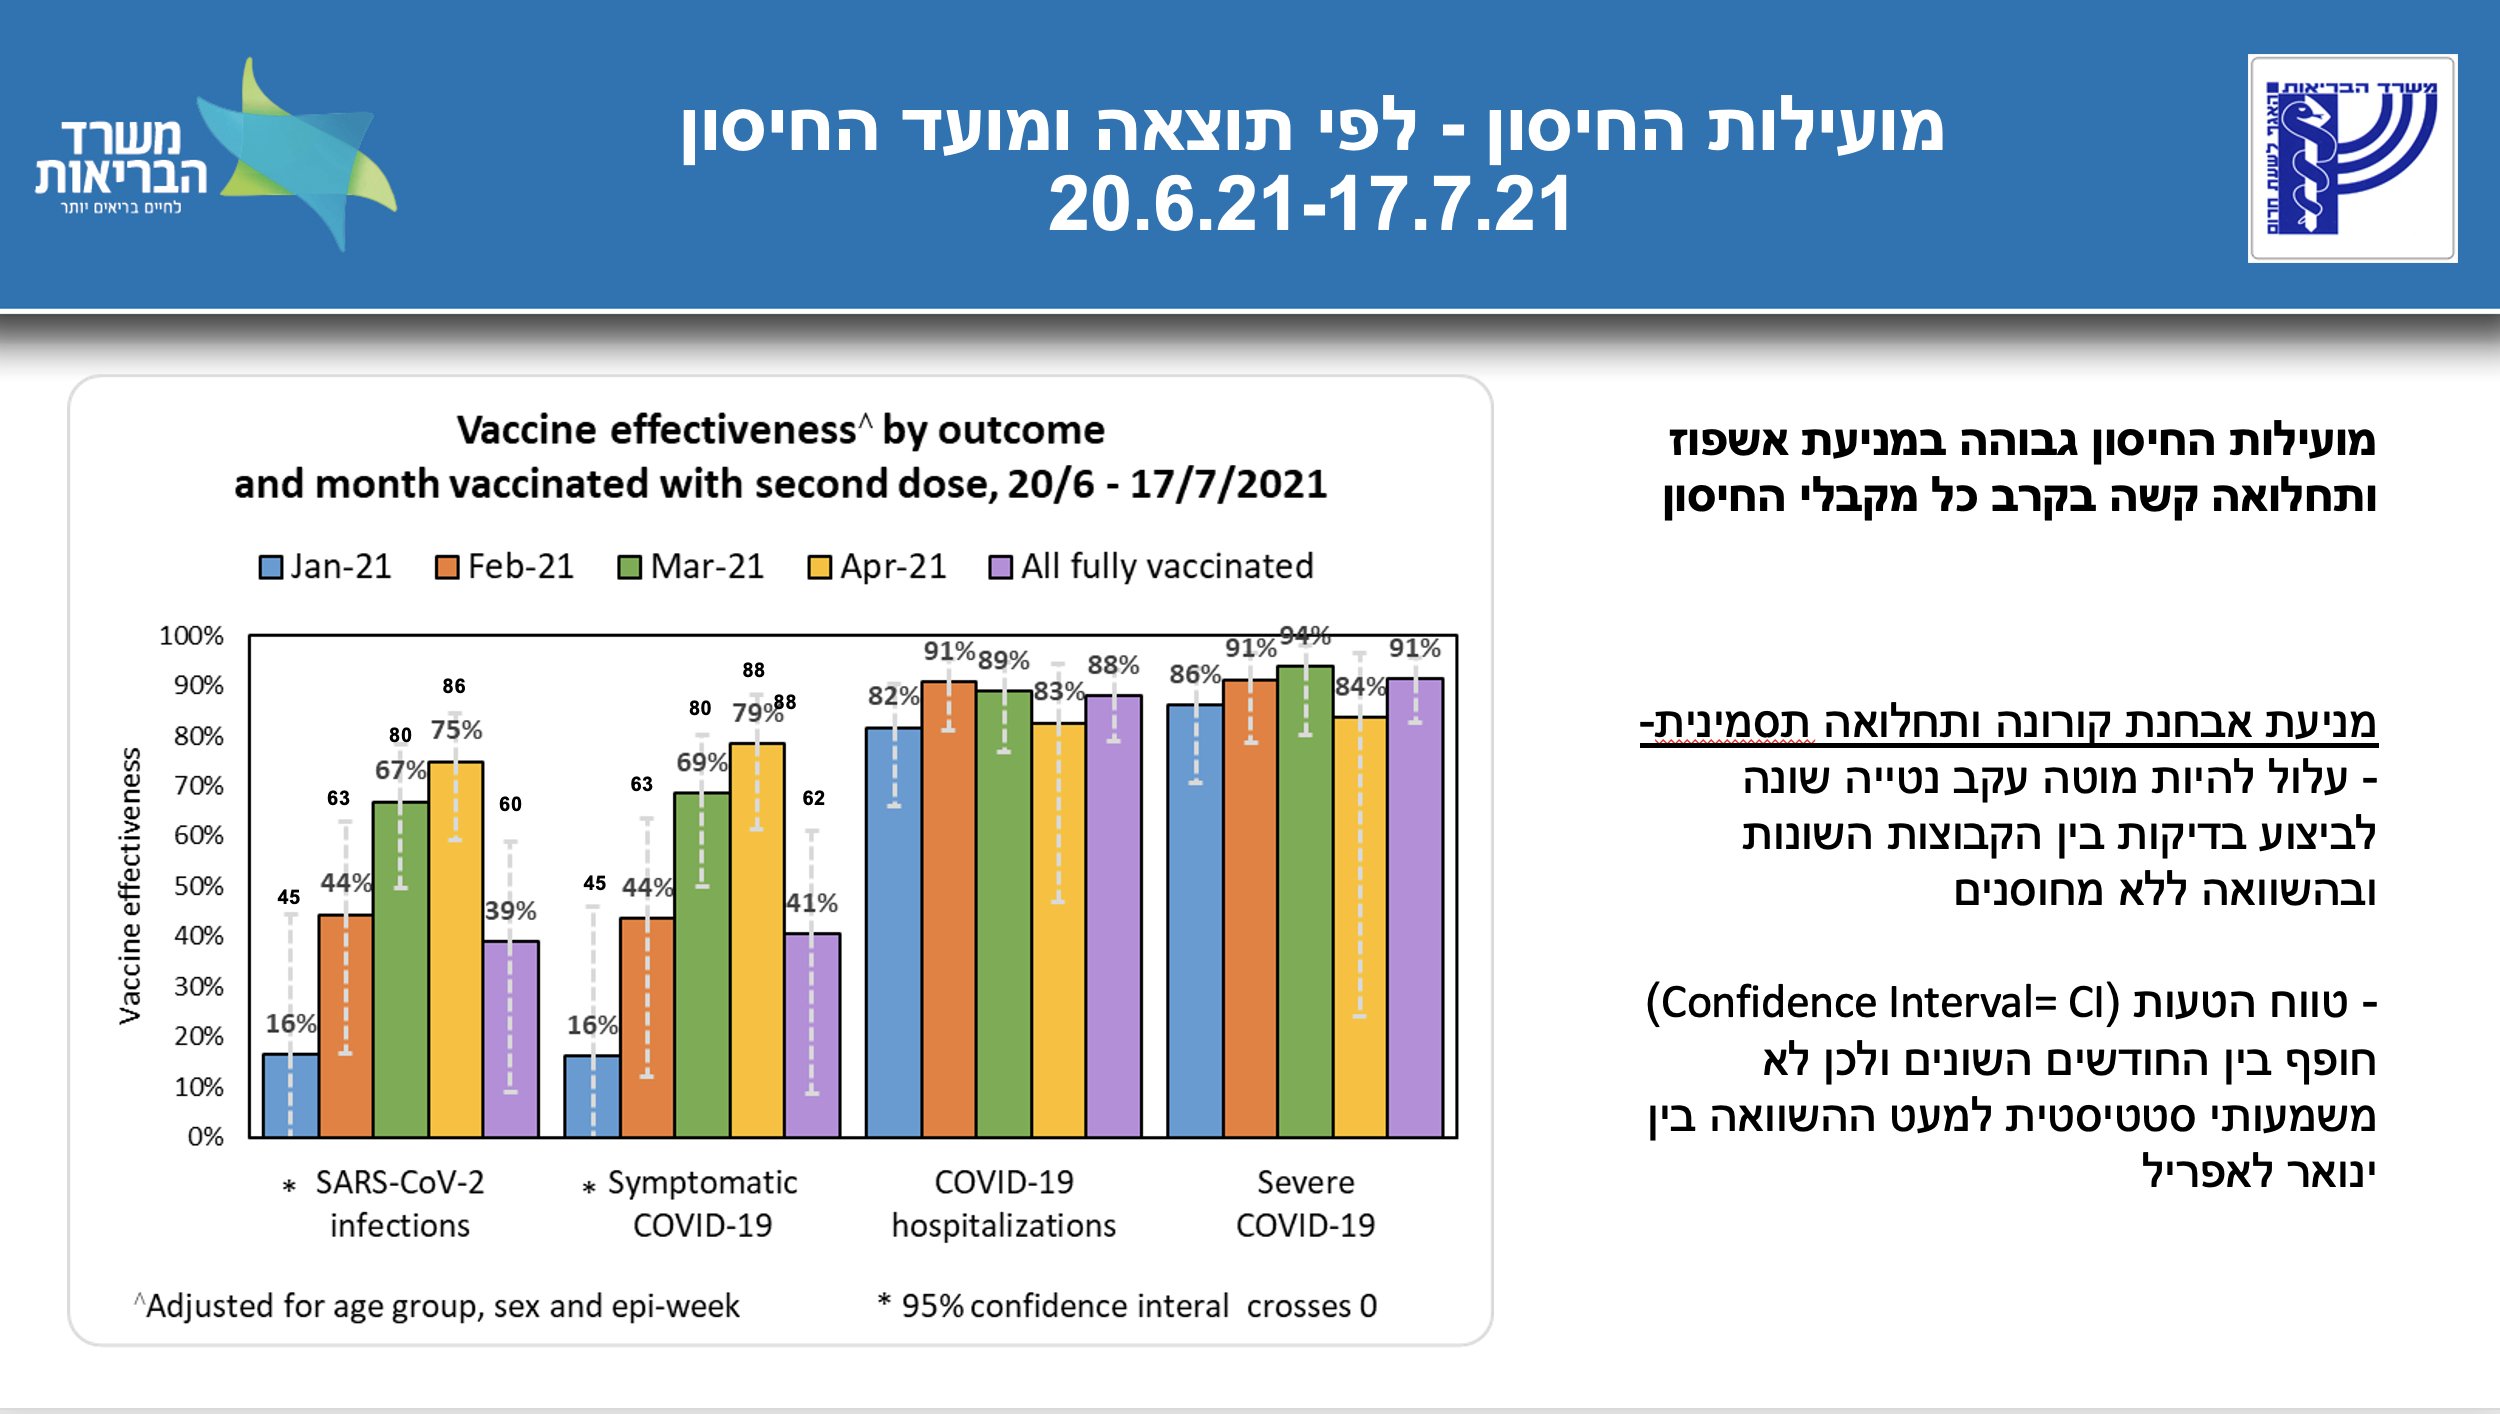
When we look at the data from Israel regarding breakthrough infections, for people who got the second shot over 6 months ago, it gives only around 16% protection against infection versus a unvaccinated person. see the following image and the full report 3.
Now we can also look at data from the UK, first it should be noted that of the fully vaccinated about 54% is vaccinated with Astra and 43% with Pfizer 4 (the rest is Moderna or rounded).
around 19.4 million and 24.0 million second doses of the Pfizer/BioNTech vaccine and COVID-19 Vaccine AstraZeneca respectively.
If we look at the last 5 weeks, we find values below 20%, every single time, from as low as 10.1% to as high as 18.4%. Below is a tiny overview of those numbers:
- 29th Aug preventing infection: 14.1% 5
- 6th Sept preventing infection: 10.1% 6
- 12th Sept preventing infection: 10.2% 7
- 19th Sept preventing infection: 18.4% 8
- 25th Sept preventing infection: 18.3% 9
Another source that confirms the same and does the calculations based on data from PHE (Public Health England) finds the same with 17% effectiveness against infection 10. (Small update, weeks of october 4th gives only 8.1% and the week of 9 Oct is even negative)
All in all that is a good indicator the VEI is below 20%, and probably around 15%. It also suggests that the VEI for both Pfizer and Astrazeneca are similar, if not the value should have been noticeably (significantly) different from 16%.
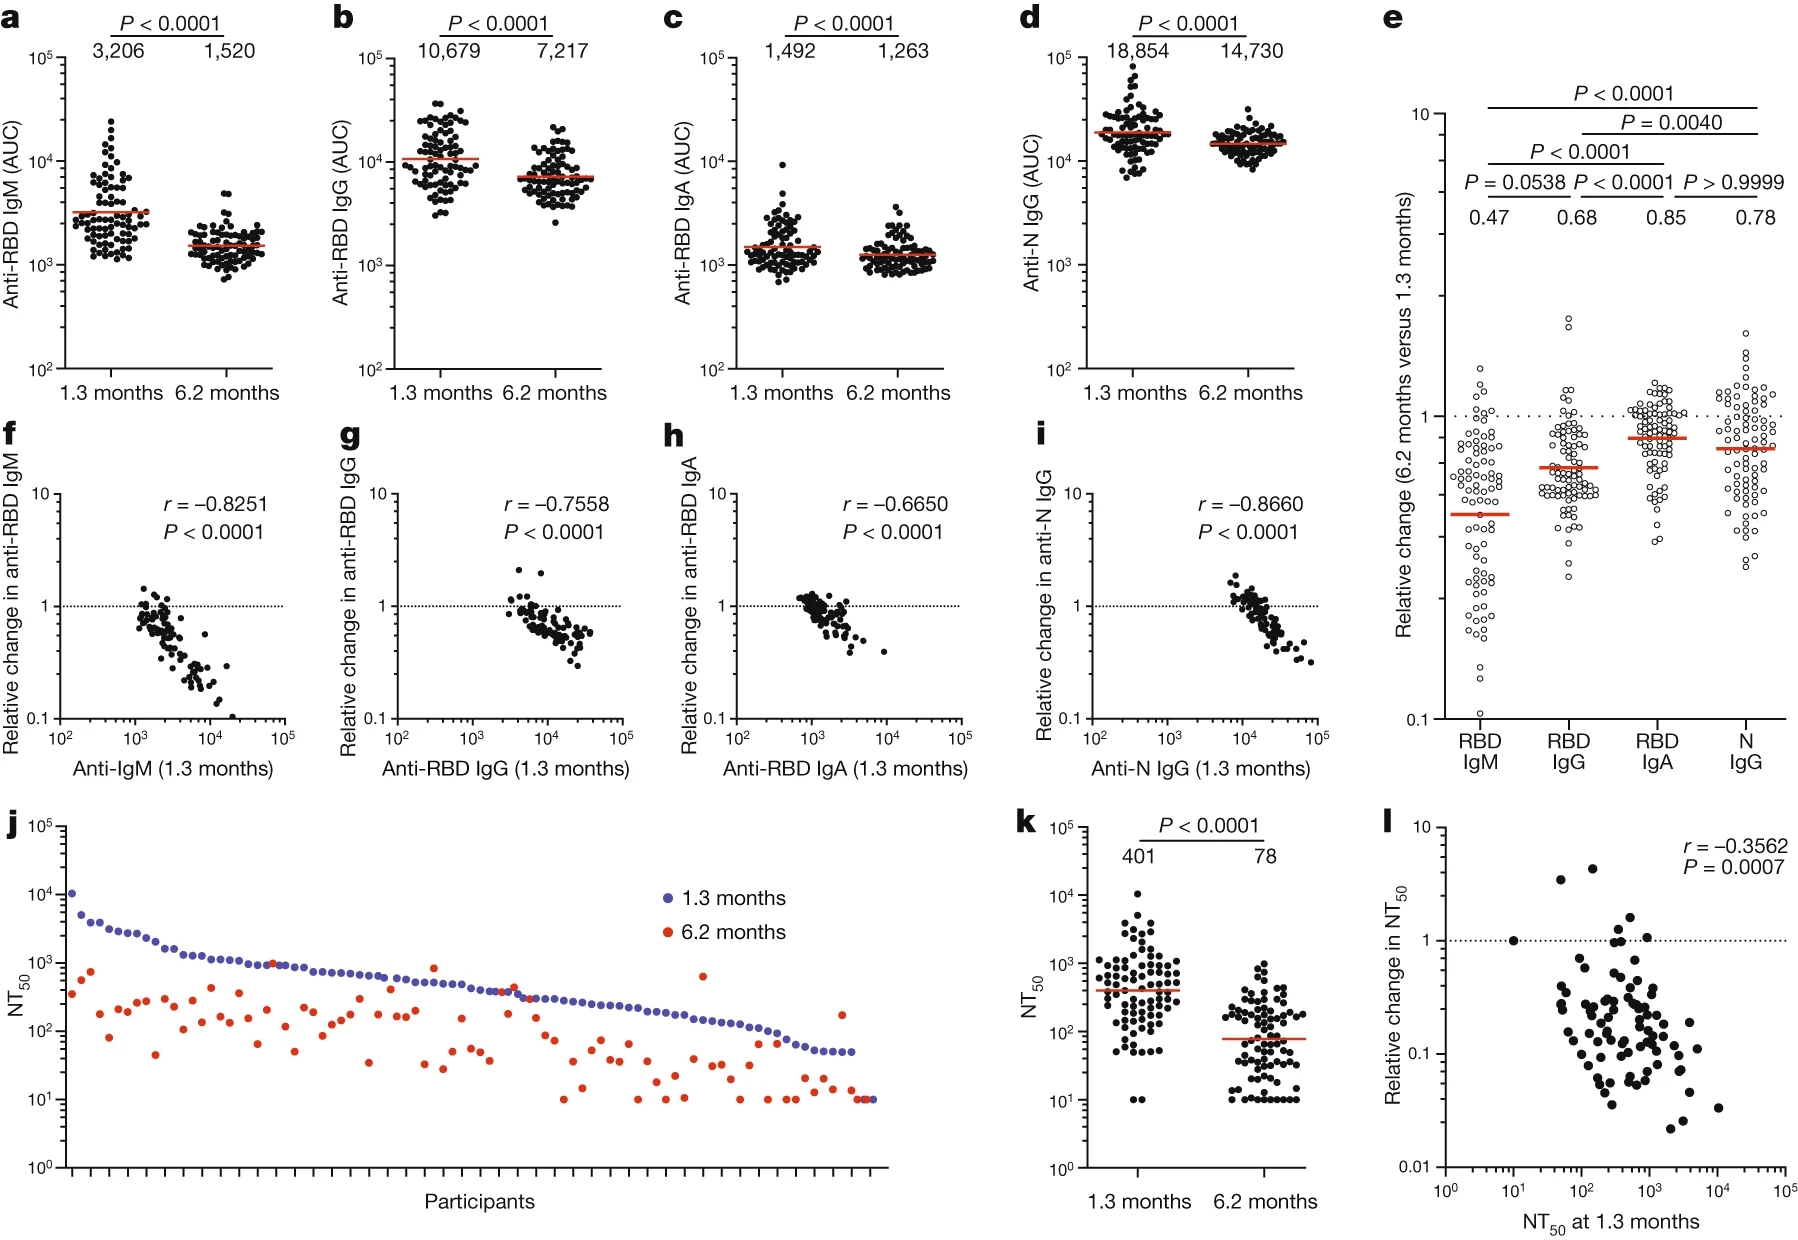
Now I often hear people blame it all on Delta and say that Delta is the biggest factor, while this could have been the case for the mRNA vaccines due to their high specificity based on a single protein, this wouldn't make all to much sense for the Astrazeneca vaccines (Adeno vector). More importantly, it's been shown that antibody levels do significantly decrease over time. There are several studies that show so pretty convincingly, see some of the images below from those studies11 12 13 14 (note some use log scale):


Finding the VEI
This is the hardest value to find and estimate and there are a few approaches that I'll take to show a range of values for this, in the end I'll also give an indication of what's most likely to be a reasonable assumption for the value.
Now most sources that I have found expect vaccinated people to be about as infectious as unvaccinated, these being government sources and scientific papers. Let's look at those first before we take a better look at estimating the value. Keep in mind the lower the Ct (cycle treshold) values the higher the viral load and the more infectionious a person is expected to be.
In the technical briefing number 20 from the UK the following is writing15:
In the NHS Test and Trace (NHSTT) case data, the mean and median lowest Ct values for all cases with Delta, where Ct data are available, since the 14 June 2021 are similar, with a median of 17.8 for unvaccinated and 18.0 for those with 2 vaccine doses (Figure 12). This means that whilst vaccination may reduce an individual’s overall risk of becoming infected, once they are infected there is limited difference in viral load (and Ct values) between those who are vaccinated and unvaccinated. Given they have similar Ct values, this suggests limited difference in infectiousness.
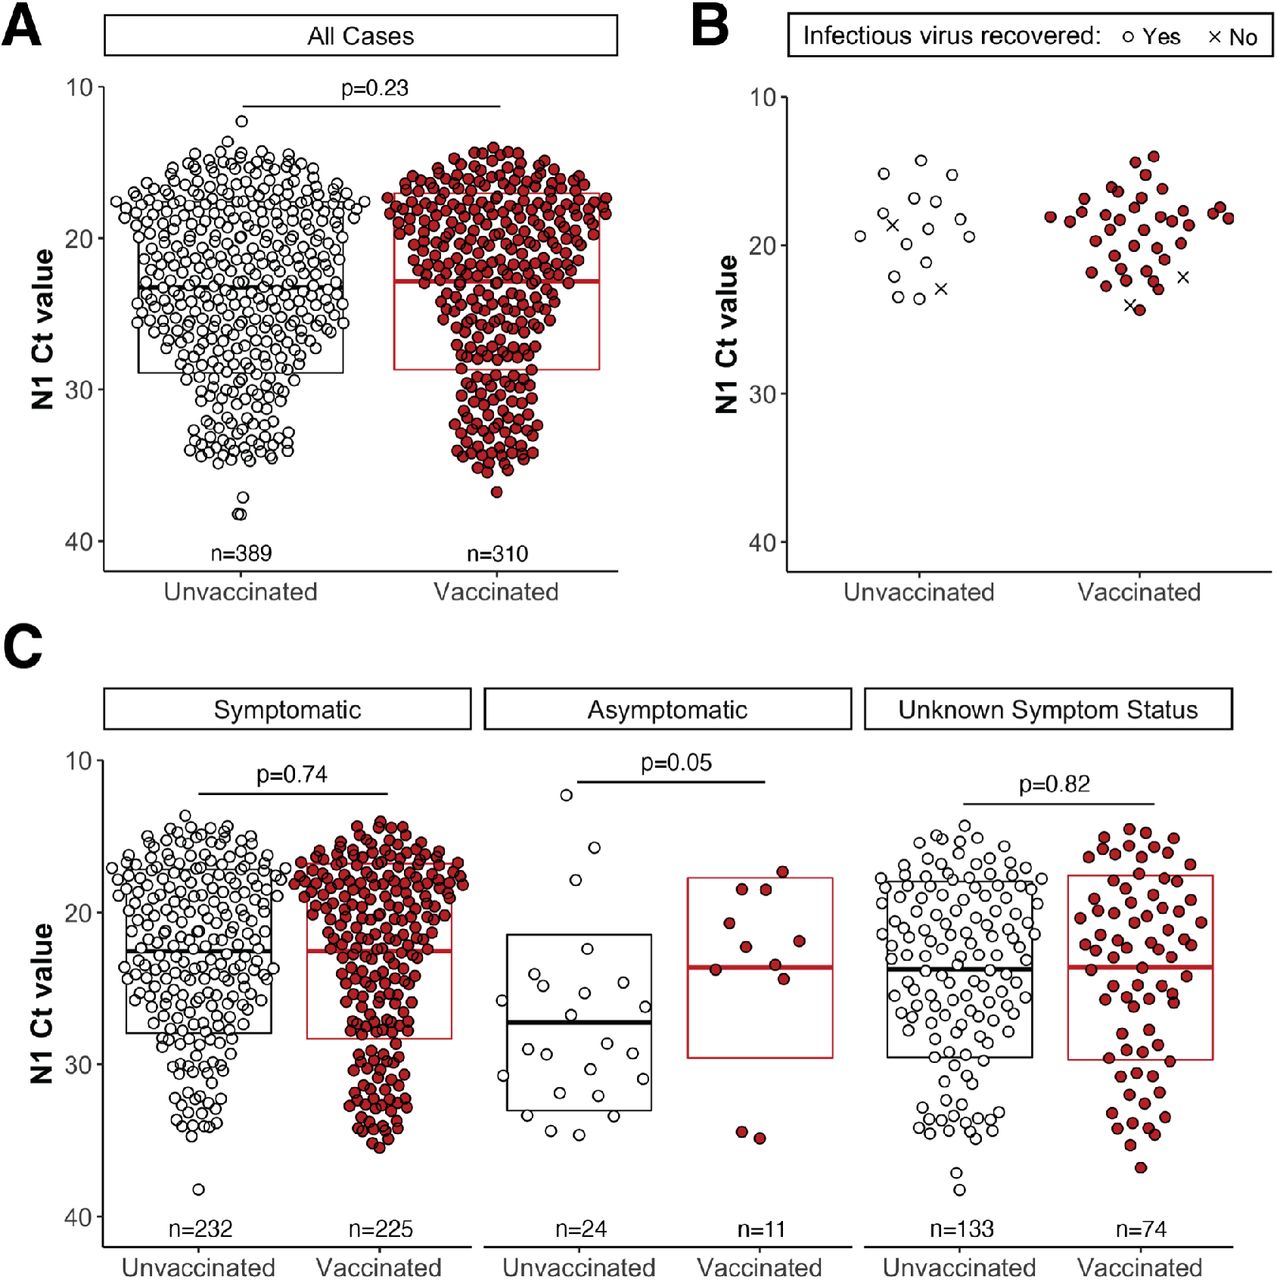
Furthermore this scientific publication indicates and mentions similar results followed by an image showing how similar (median) Ct values are 16.
Testing a subset of low-Ct samples revealed infectious SARS-CoV-2 in 15 of 17 specimens (88%) from unvaccinated individuals and 37 of 39 (95%) from vaccinated people (Figure 1B).
Even the CDC found similar results, which can be read about in this news article https://www.pbs.org/newshour/health/study-vaccinated-people-who-got-breakthrough-infections-can-carry-as-much-virus-as-others, or in their own rapport 17.
Real-time reverse transcription–polymerase chain reaction (RT-PCR) cycle threshold (Ct) values in specimens from 127 vaccinated persons with breakthrough cases were similar to those from 84 persons who were unvaccinated, not fully vaccinated, or whose vaccination status was unknown (median = 22.77 and 21.54, respectively).
Now lastly we'll look at the paper we'll also use for making estimations, among with 2 other studies to do so. There are a few things to point out later but let's first look at the Ct values for vaccinated and unvaccinated according to this paper18.
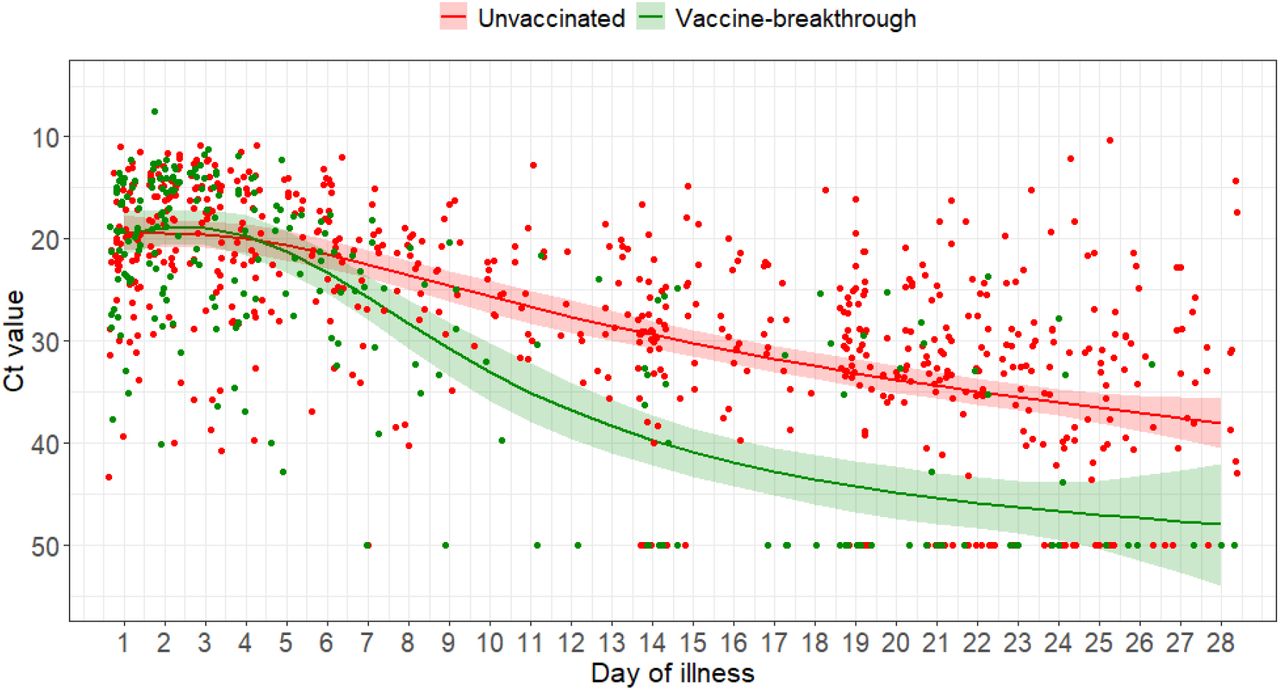
The initial median initial Ct value did not differ between unvaccinated and fully vaccinated patients (unvaccinated median Ct 18.8 (14.9-22.7), vaccinated 19.2 (15.2-22.2), p=0.929). However, fully vaccinated patients had a faster rate of increase in Ct value over time compared with unvaccinated individuals, suggesting faster viral load decline ...
Now people will be quick to point out or wonder but if the decline in viral load is significantly quicker then how can you say that they are similarly infectious? Well this is because of how Covid-19 is mostly spread and when. Most of it is spread during peak infectionious which is only around 2-4 days in the beginning of the illness (around incubation).
Now there are two news articles that explain why a minority of people spreads the disease 19 https://heavy.com/news/2020/08/covid-19-study-new/
The Fred Hutchinson Cancer Research Center study,
which is a preprint study and therefore has not been peer-reviewed, found that COVID-19 is typically passed through “super-spreader events” — and only 20% of those who test positive will transmit it to others.
Super-Spreaders Happen When Someone Is at Their ‘Peak Contagious Point’
and the other news article https://archive.is/laVcR
“What I mean by that is that there are a relatively small, but really important proportion of spreading events where one person infects 10 people, or sometimes 50 people, or sometimes 100 people,” explained Dr. Schiffer. “Yet 80% of people with this virus don't infect anybody.”
Lastly 20
Just 2% of SARS-CoV-2−positive individuals carry 90% of the virus circulating in communities

All in all it should looks clear why vaccinated people are estimated to be similarly infectious. Nonetheless there are some things we can do to make an estimation of VEI. Looking at source(footnote) 18 we can take that image and extract the data using Matlab and Grabit. After we do this we can use that data to fit a polynomial, since we are only going to look at data between 1 and 28 (days as per the graph) we don't have to worry about extrapolation errors. Now the only thing we have to do is correlate the Ct value (logarithmic, power of 2) to something more tangible directly related to infectionious. Basically we need some kind of calibration curve. There's two options for this, 1 we estimate the viral load (virions/ml) based on Ct values, 2 we look at the the percentage of positive cell cultures for a corresponding Ct value.
First let's take a look at the fits found for these two graphs, unvaccinated and vaccinated:
- Ct_unvac= -5.7387e-06.*x.^5 +0.00053878.*x.^4 -0.019101.*x.^3 +0.29862.*x.^2 -1.05683.*x +20.4642303834689
- Ct_vac=-2.9264e-05.*x.^5 +0.0025370.*x.^4-0.081426.*x.^3+1.1249.*x.^2-4.5183.*x+24.217
Where x is the amount of days and below you can see a quick plot of it:

Now as I said we need have two methods for calibrating, this is done based on two papers from which we can find the following equations:
- Concentration for CU N primer = 10.^(-(1/3.08).*(Ct-46.58)); or Concentration for CU E primer = 10.^(-(1/2.52).*(Ct-43.88)); 21
- Positive cell culture percentage = -0.1132.*(Ct-11).^2 - 1.3771.*(Ct-11) + 100.13; 22
After that we can check the relative area under the graphs for vaccinated and unvaccinated to get an idea for the RR. This specific RR is the same as 1-VEI. It's important to remember that Ct values are log scale, every time Ct is increased by one, it means the viral load should be about half (every time it's decreased by one it's doubled). The next plot shows the viral loads for each of the curves according to the equations at point 1.

Now if we look at this, it becomes really clear why the peaks are so important and why the overwhelming infectiousness is there. While the RR should be below 1 to indicate less risk for a vaccinated person, here we find values above one of 1.14 and 1.25. In reality this an indicator that most likely vaccinated people are about as infectious as unvaccinated.
Even though this is not the best comparison type we can still look at the percentage of positive cell cultures in the next plot.

Here we find a RR of 0.586, or a VEI of 0.414. Lastly we can look at the Median values instead of the area as given by the UK and the paper mentioned before, 17.8(unvac) and 18.0(vac), or 18.8(unvac) and 19.2(vac). Again as Ct itself doesnt say much we can look what the RR would be for positive cell culture values and viral load values. For positive cell culture percentage we find 0.996 and 0.99 respectively, for Viral load with the CU-N primer we find 0.861 and 0.742 respectively, while with the CU-E primer we find 0.833 and 0.694 respectively. In the end, look at other reports and data, also the CDC one where a higher percentage of vaccinated infected people was found than the percentage that was vaccinated in the population at that time 74% of the people found to be infected was vaccinated (source/footnote 17 cdc), while only 61% of the population at that time was vaccinated 23 24 (note other factors like behaviour could have played a role, due to extra perceived safety). Update: A new publication indicates the same, that the effect of vaccines reducing spread is not observable under the imposed measures, showing no correlation between vaccination rate and cases 25.
So looking at all these numbers most likely the RR is somewhere close to 1, this would mean vaccinated and unvaccinated once infected are equally infectious (on average, also see the technical briefing number 20 from the UK again), another reasonable value when looking at and comparing median values would be around 0.85 (average 6 values), and lastly we can take the best case scenario, looking at the RR of the positive cell culture which would be 0.586. This gives 3 values for the VEI, 0, 0.15, and 0.414.
VET compared to the FNR
Now it is possible to calculate the VET with these 3 values we have gotten the VEI, for the VES we'll assume 0.15 as mentioned before:
- VET = 1-(1-0.15)(1-0) = 0.15
- VET = 1-(1-0.15)(1-0.15) = 0.2775
- VET = 1-(1-0.15)(1-0.414) = 0.502 (fairly unlikely though)
While we looked at the FNR it is around 0.1 and in the absolute worse case 0.3, this means that the risk an untested vaccinated person poses in comparison to a tested unvaccinated person is significantly higher, with the RR of them ranging from 1.66 (0.5/0.3) to up to 8.5 (0.85/0.1) times as high to have caught it and infect someone else.
This is because to calculate the RR we need to first convert all values to the RR and then divide those numbers. This means that 15% VET is 0.85 RR with the baseline of untested and unvaccinated, while 28% VET is 0.72 RR, and 50% is 0.5 RR. While the RR for a sensitivity of ~90% is 0.1 RR (0.02 to 0.3). So the RR goes from 1.66 (0.5/0.3) to 8.5 (0.85/0.1) or maybe slightly higher even.
Again 0.9 (0.7-0.98) > 0.28 (0.15-0.5), or RR ~= 7.2 (0.72/0.1)
Lastly perceived immunity can cause people to not warrant symptoms (especially since they're mild) or risks as well, increasing the relative risk further due to possible more risky behaviour (see Massachusetts by example). It's often not explained well that immunity does not mean full immunity (sterile immunity), which gives people the wrong impression.
In the end though looking at the relative risk between an unvaccinated person that is tested and an untested vaccinated person, it makes 0 scientific nor logical sense that it's claimed that people are safe if they are just vaccinated. If you want to test, then logically and scientifically you NEED to test BOTH.
DISCLAIMER, nowhere nor will I ever say that vaccines are useless or don't reduce the severity and the RR for death, especially in older people and other high risk categories (diabetes, lung conditions, etc). However not everyone is exposed to the same risk and forcing people to take it to reduce spread is probably not going to be very effective, especially when a majority (70%+) has already been vaccinated. By example in the Netherlands 80% of above 12 years has been fully vaccinated.
https://virologyj.biomedcentral.com/articles/10.1186/s12985-021-01489-0↩
https://www.ncbi.nlm.nih.gov/pmc/articles/PMC8197448/ equation 1↩
https://www.gov.il/BlobFolder/reports/vaccine-efficacy-safety-follow-up-committee/he/files_publications_corona_two-dose-vaccination-data.pdf↩
https://www.gov.uk/government/publications/coronavirus-covid-19-vaccine-adverse-reactions/coronavirus-vaccine-summary-of-yellow-card-reporting↩
https://www.fil.ion.ucl.ac.uk/spm/covid-19/forecasting/forecasting_290821.pdf↩
https://www.fil.ion.ucl.ac.uk/spm/covid-19/forecasting/forecasting_060921.pdf↩
https://www.fil.ion.ucl.ac.uk/spm/covid-19/forecasting/forecasting_190921.pdf↩
https://www.fil.ion.ucl.ac.uk/spm/covid-19/forecasting/forecasting_250921.pdf↩
https://www.fil.ion.ucl.ac.uk/spm/covid-19/forecasting/forecasting_120921.pdf↩
https://dailysceptic.org/2021/08/06/devastating-new-data-from-phe-shows-vaccine-effectiveness-down-to-17-and-no-reduction-in-infectiousness-but-mortality-cut-by-77/↩
https://www.thelancet.com/journals/lancet/article/PIIS0140-6736(21)01642-1/fulltext↩
peer reviewed new and updated image https://doi.org/10.1056/NEJMoa2114114 old pre peer review can be seen here https://www.medrxiv.org/content/10.1101/2021.08.25.21262584v1.full-text↩
https://www.medrxiv.org/content/10.1101/2021.09.04.21263115v1.full-text↩
https://assets.publishing.service.gov.uk/government/uploads/system/uploads/attachment_data/file/1009243/Technical_Briefing_20.pdf↩
https://www.medrxiv.org/content/10.1101/2021.07.31.21261387v4.full↩
https://www.medrxiv.org/content/10.1101/2021.07.28.21261295v1.full-text↩
Fairly advanced and in depth paper https://elifesciences.org/articles/63537↩
https://www.pnas.org/content/118/21/e2104547118 see supplemental info for equations, converted from having the concentration as the x variable to having the Ct as the x value https://www.pnas.org/content/pnas/suppl/2021/05/06/2104547118.DCSupplemental/pnas.2104547118.sapp.pdf↩
https://www.pnas.org/content/pnas/suppl/2021/05/06/2104547118.DCSupplemental/pnas.2104547118.sapp.pdf↩
https://www.mass.gov/doc/weekly-covid-19-vaccination-report-july-22-2021/download 22 of July 4.3 million people where fully vaccinated in Massachusetts↩
https://worldpopulationreview.com/states/massachusetts-population Massachusetts at that time had 6.9 to 7.1 million inhabitants (I'll assume 7 million).↩
https://www.ncbi.nlm.nih.gov/pmc/articles/PMC8481107/?fbclid=IwAR1zgxjfO4mHTfOg6gqyAN8sWnXSJjEZuAlDKyKawDntZOt5ZW7hrka6v5w#!po=23.3333↩